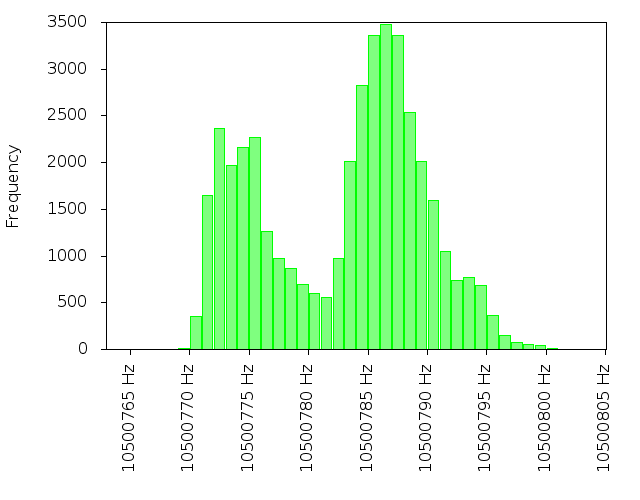
Relevant statistics:
1ms or better accuracy on a USB-connected GPS.
stm32f4 discovery board using a 10.5mhz internal timer is measuring the PPS interval from a Fastrax UP501 GPS reciever (claims "+/- 50 ns (RMS) accuracy"). The stm32f4 is connected via full-speed usb to a pc
CDC_IN_FRAME_INTERVAL (the number of USB polls to skip between responses) set to 1
First graph is a histogram of the number of cycles of the 10.5mhz timer between PPS signals. This covers 41k samples (over 14 hours) worth of data. Data for pulses that take longer than 1 second are ignored.

Relevant statistics:
   mean: 10500782 Hz
std dev: 7.60
    min: 10500769 Hz
    max: 10500800 Hz
Conclusion: The range is still 73ppm-76ppm off. Should result in an error of 6µs or less (while PPS is active)
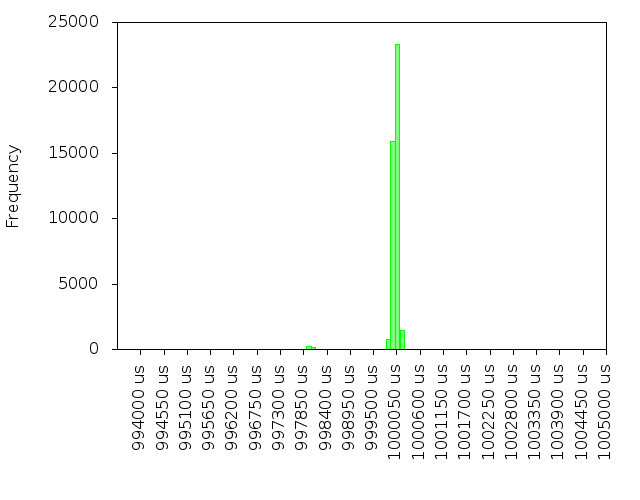
The stm32f4 board is configured to emulate a USB-serial adapter, and is printing the interval data to a PC. The PC timestamps each message recieved and this graph shows the histogram of the intervals between messages. Ideally all samples would be at exactly 1 second.
Relevant statistics:
   mean: 0.999999 s
std dev: 0.000206
    min: 0.997097 s
    max: 1.002943 s
Conclusion: Changing the frequency of responses to the USB poll lowered the range of errors from 9.5ms to 5.8ms
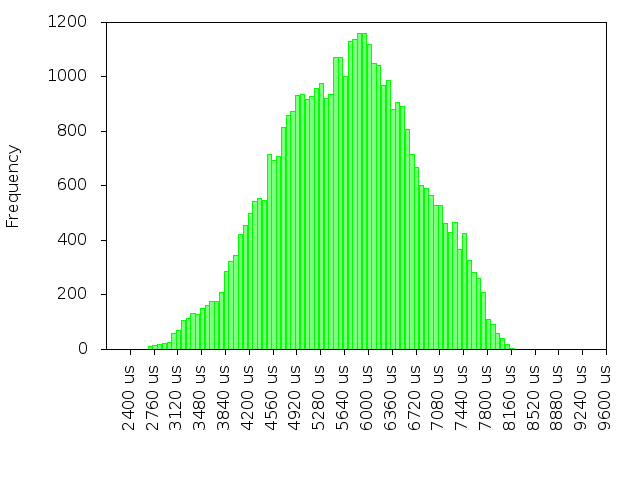
The PC also saves the microsecond portion of the timestamp. PC is configured to get its time from the internet via NTP, so this next graph contains both the USB polling errors (of ~5.8ms), local clock errors, as well as any internet-influcened NTP errors (error between 1ms and 22ms for the sources configured). Ideally, this graph would be 100% of samples at 0 µs
Relevant statistics:
   mean: 5657 µs
std dev: 1031
    min: 2649 µs
    max: 9511 µs
Conclusion: The mean lowered by almost 2ms and the width lowered by 1.6ms
Next is a graph comparing NTP's local clock offset (from loopstats) to the GPS timestamps. Since the NTP timestamps will always be offset from the actual time due to how my internet connection works, I've shifted NTP's time to be 5ms higher
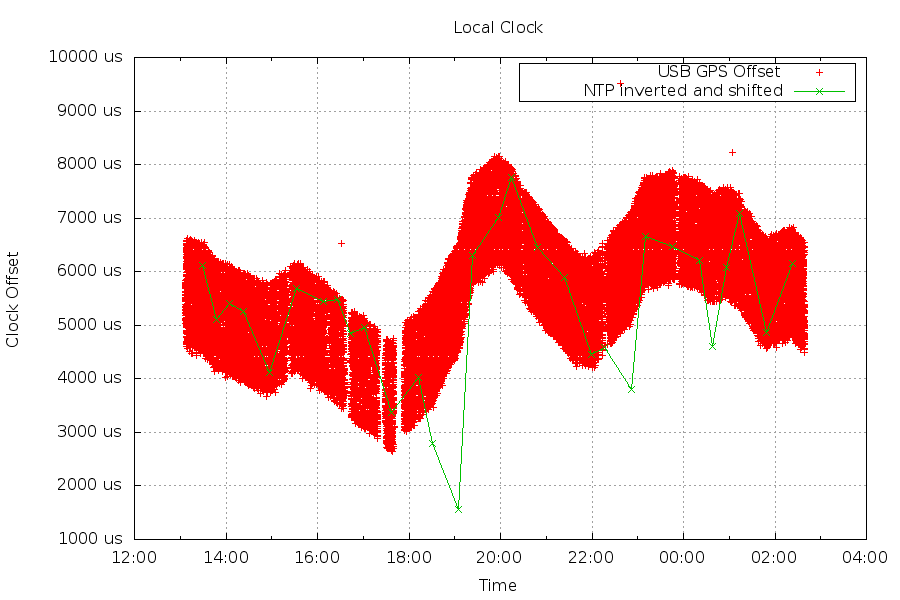
Conclusion: From 15:00-18:00, I had spotty GPS coverage (I'm using a module with a built-in antenna and it's indoors). NTP was more erratic for this run, possibly due to occasionally increased latency.
This graph is trying to show how one-way latency effects NTP measurements. There are two different stratum 2 servers in the graph. Each errorbar is a NTP measurement, with the middle point being the offset from the local clock to the remote clock. The bar edges show the latency of the measurement.
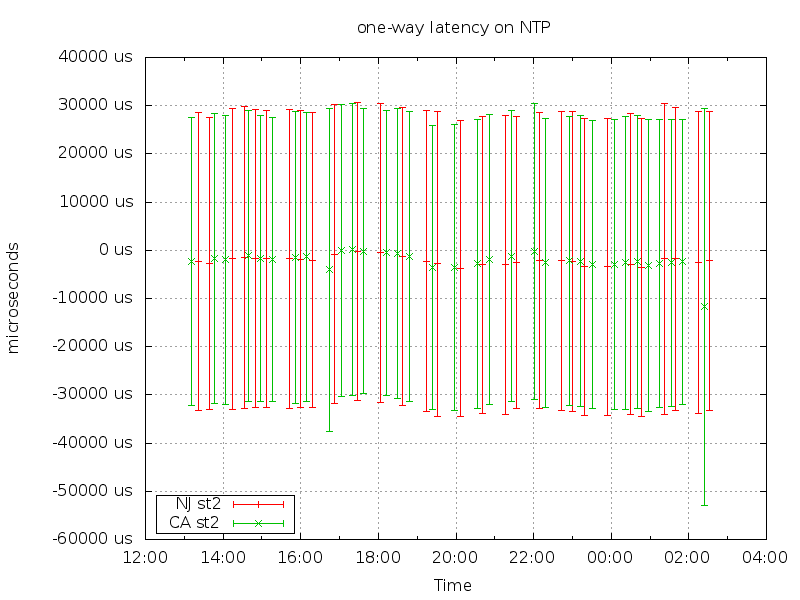
Conclusion: The "CA st2" server at times 16:45 and 2:30 was effected by some one-way latency event (perhaps local traffic queued at my cable modem). The top of the bar lines up with the other measurements, showing that the time to get from my computer to the remote server was delayed, while the return time was the same. If both the outbound and return paths were delayed, the middle of the bar would line up and the tops of the bar would not. The 16:45 packet was delayed an extra 5ms and the 2:30 packet was delayed an extra 10ms.
This change lowered the window between the PPS happening and the computer getting it from 6ms wide to 2ms wide.